What is a Relationship in Power BI?
A relationship connects a column in one table to a column in another, creating a pathway for data to flow. Power BI uses these connections to understand how rows correspond, enabling accurate filtering and aggregation. This concept is foundational to business intelligence, much like how Database Normalization ensures data integrity in transactional systems.
Why Relationships Matter
Correct relationships ensure that calculations return the right totals and reports perform efficiently. Poorly defined models lead to broken slicers and slow rendering.
Types of Schemas in Power BI
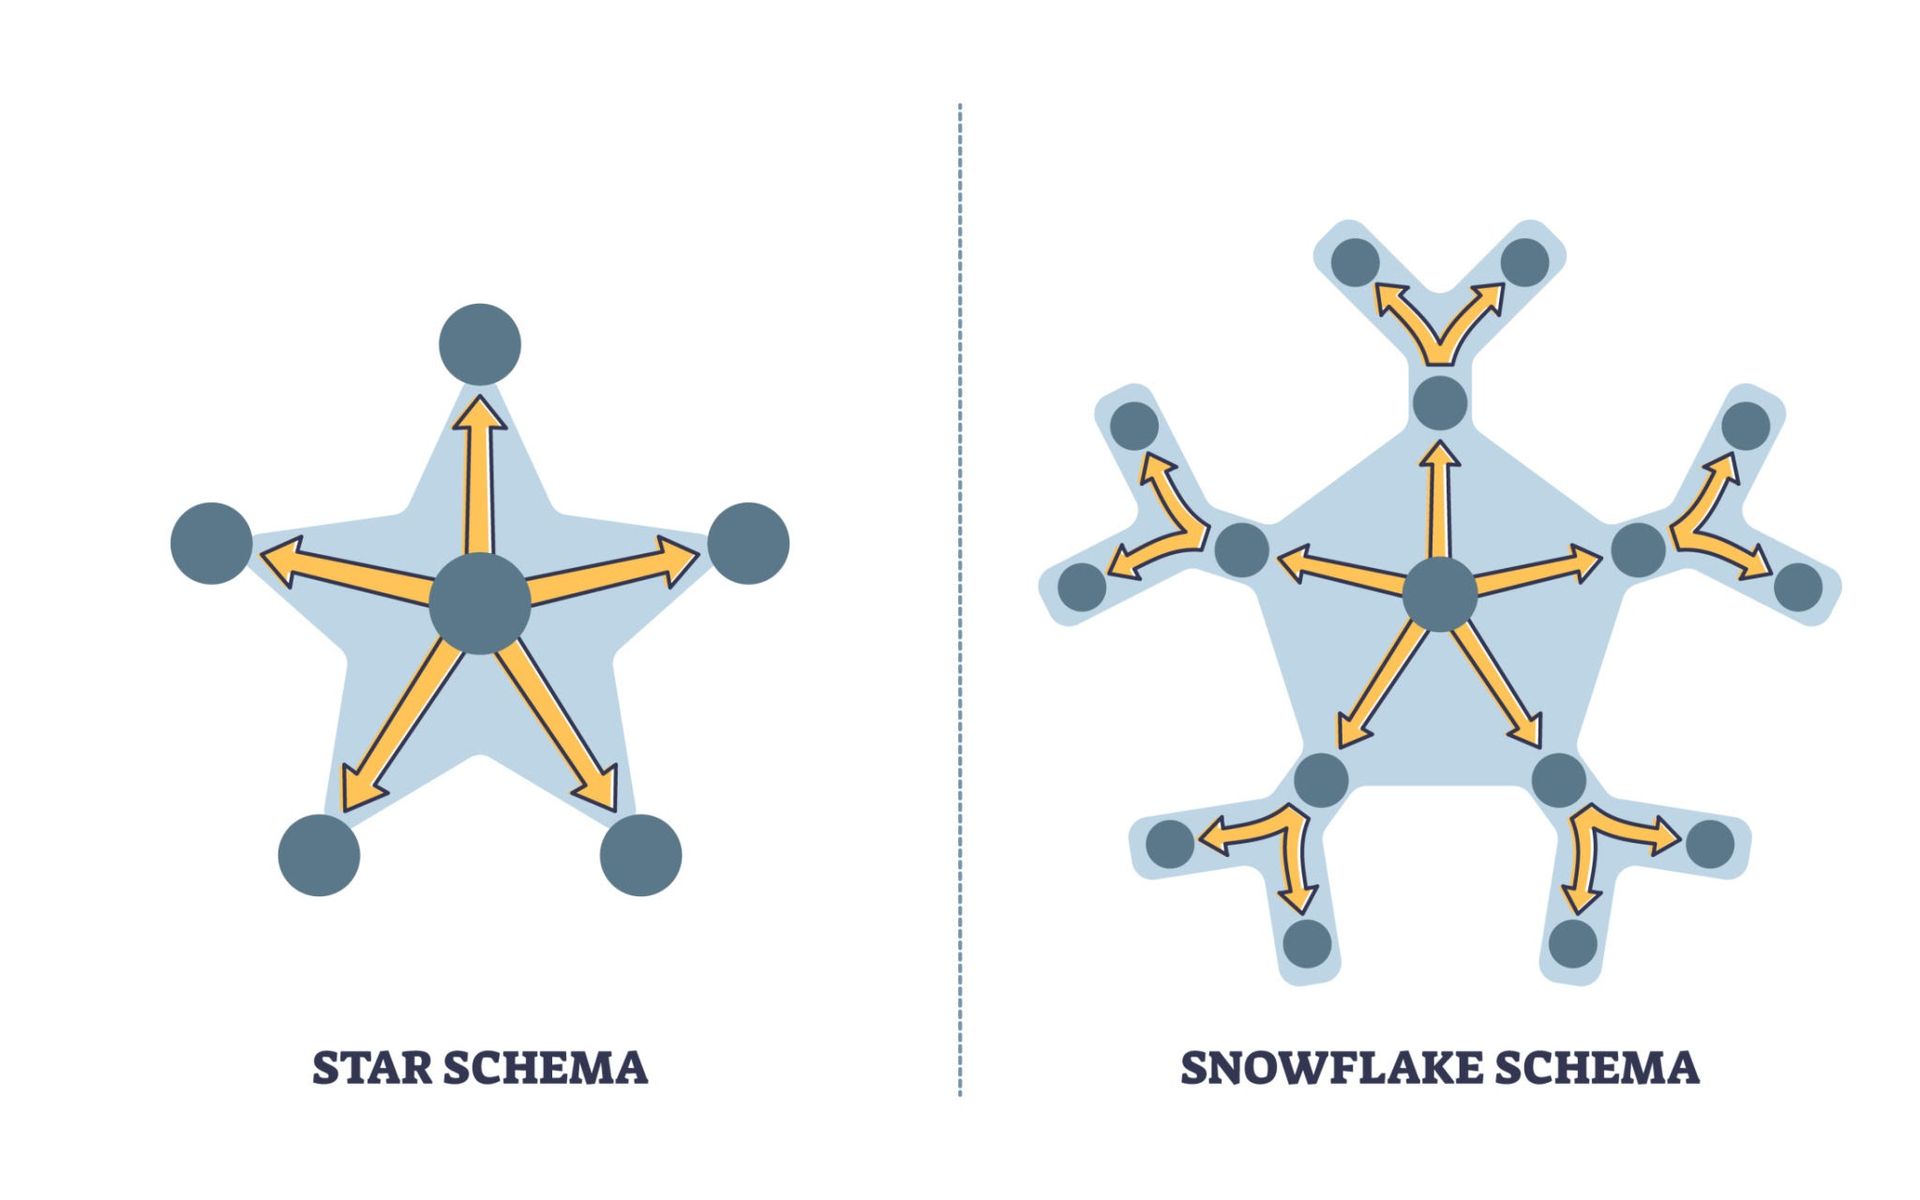
Choosing the right schema influences query performance and model simplicity.
- Star Schema: Dimension tables connect directly to a single fact table (Recommended).
- Snowflake Schema: Dimension tables are normalized into sub‑dimensions, creating additional joins.
- Galaxy Schema: Multiple fact tables share common dimensions, often seen in complex enterprise environments.
Fact vs. Dimension Tables
Understanding the roles of tables is critical for a clean model:
- Fact Tables: Store quantitative data (numbers, metrics) and foreign keys. They typically have millions of rows.
- Dimension Tables: Provide descriptive context (Who, What, Where). These contain unique attributes used for filtering and grouping.
Relationship Cardinality and Direction
Cardinality defines how rows match between tables.
- One‑to‑Many: The gold standard for analytical models (e.g., One Product ID in the Dimension table matches Many sales in the Fact table).
- Many‑to‑Many: Both tables contain duplicate values. This should be avoided as it often introduces ambiguity.
Filter Propagation determines how slicers affect visuals.
- Single Direction: Filters flow from dimension to fact tables. This is predictable and efficient.
- Bi‑Directional: Filters flow both ways. While useful for specific patterns, it can introduce performance overhead—similar to how Circular Dependencies in Python can crash an application if not managed correctly.
Best Practices for Optimal Performance
To build a resilient data model:
- Prefer Star Schemas: They are optimized for Power BI's VertiPaq engine.
- Avoid Many-to-Many: Use bridge tables if necessary.
- Limit Bi-Directional Filters: Use DAX measures like CROSSFILTER instead of enabling it at the model level.
Conclusion
A robust data model is the backbone of any Power BI report. By adhering to star schema principles and managing cardinality effectively, developers can ensure their reports are both accurate and lightning-fast.